
Marketplace Analytics: Why Your BI Report Doesn't Match the Admin Panel

Marketplace analytics is the set of reports and metrics you use to measure sales, sellers, and buyers on your marketplace. Part of it lives in the platform's admin panel. The rest lives in your BI tool, where your analytics team builds its own reports from data exported from the platform.
You'll notice the problem at the first monthly review. The admin panel shows one turnover figure and the BI report shows another. Both are calculated correctly.
People decide with whichever number they had open. Choose one official number for each metric. Writing the definitions down takes one afternoon.
This article breaks down:
- Why does marketplace analytics in your BI report differ from the admin panel?
- What makes the same marketplace sales show different turnover in two reports?
- How does marketplace reporting differ from live data?
- Which 4 marketplace metric definitions should you write down once?
Key insights
- Marketplace analytics in your BI report differs from the admin panel because the two count different things at different moments. Both are usually correct. An eight-person committee that spends 20 minutes a month on the difference loses 32 hours a year.
- The same marketplace sales show different turnover in two reports because of six choices: the moment of measurement, the end of the day, cancellations and returns, the exchange rate, test orders, and feed delay.
- Marketplace reporting differs from live data by up to a full day. A once-a-day feed leaves about €333,000 of daily turnover out of your report until the next load.
- The 4 marketplace metric definitions to write down once are turnover, net sales after returns, conversion, and attribution of a sale to its source. Each gets one page with a formula, a source system, a named owner, and the date it last changed.
Why does marketplace analytics in your BI report differ from the admin panel?
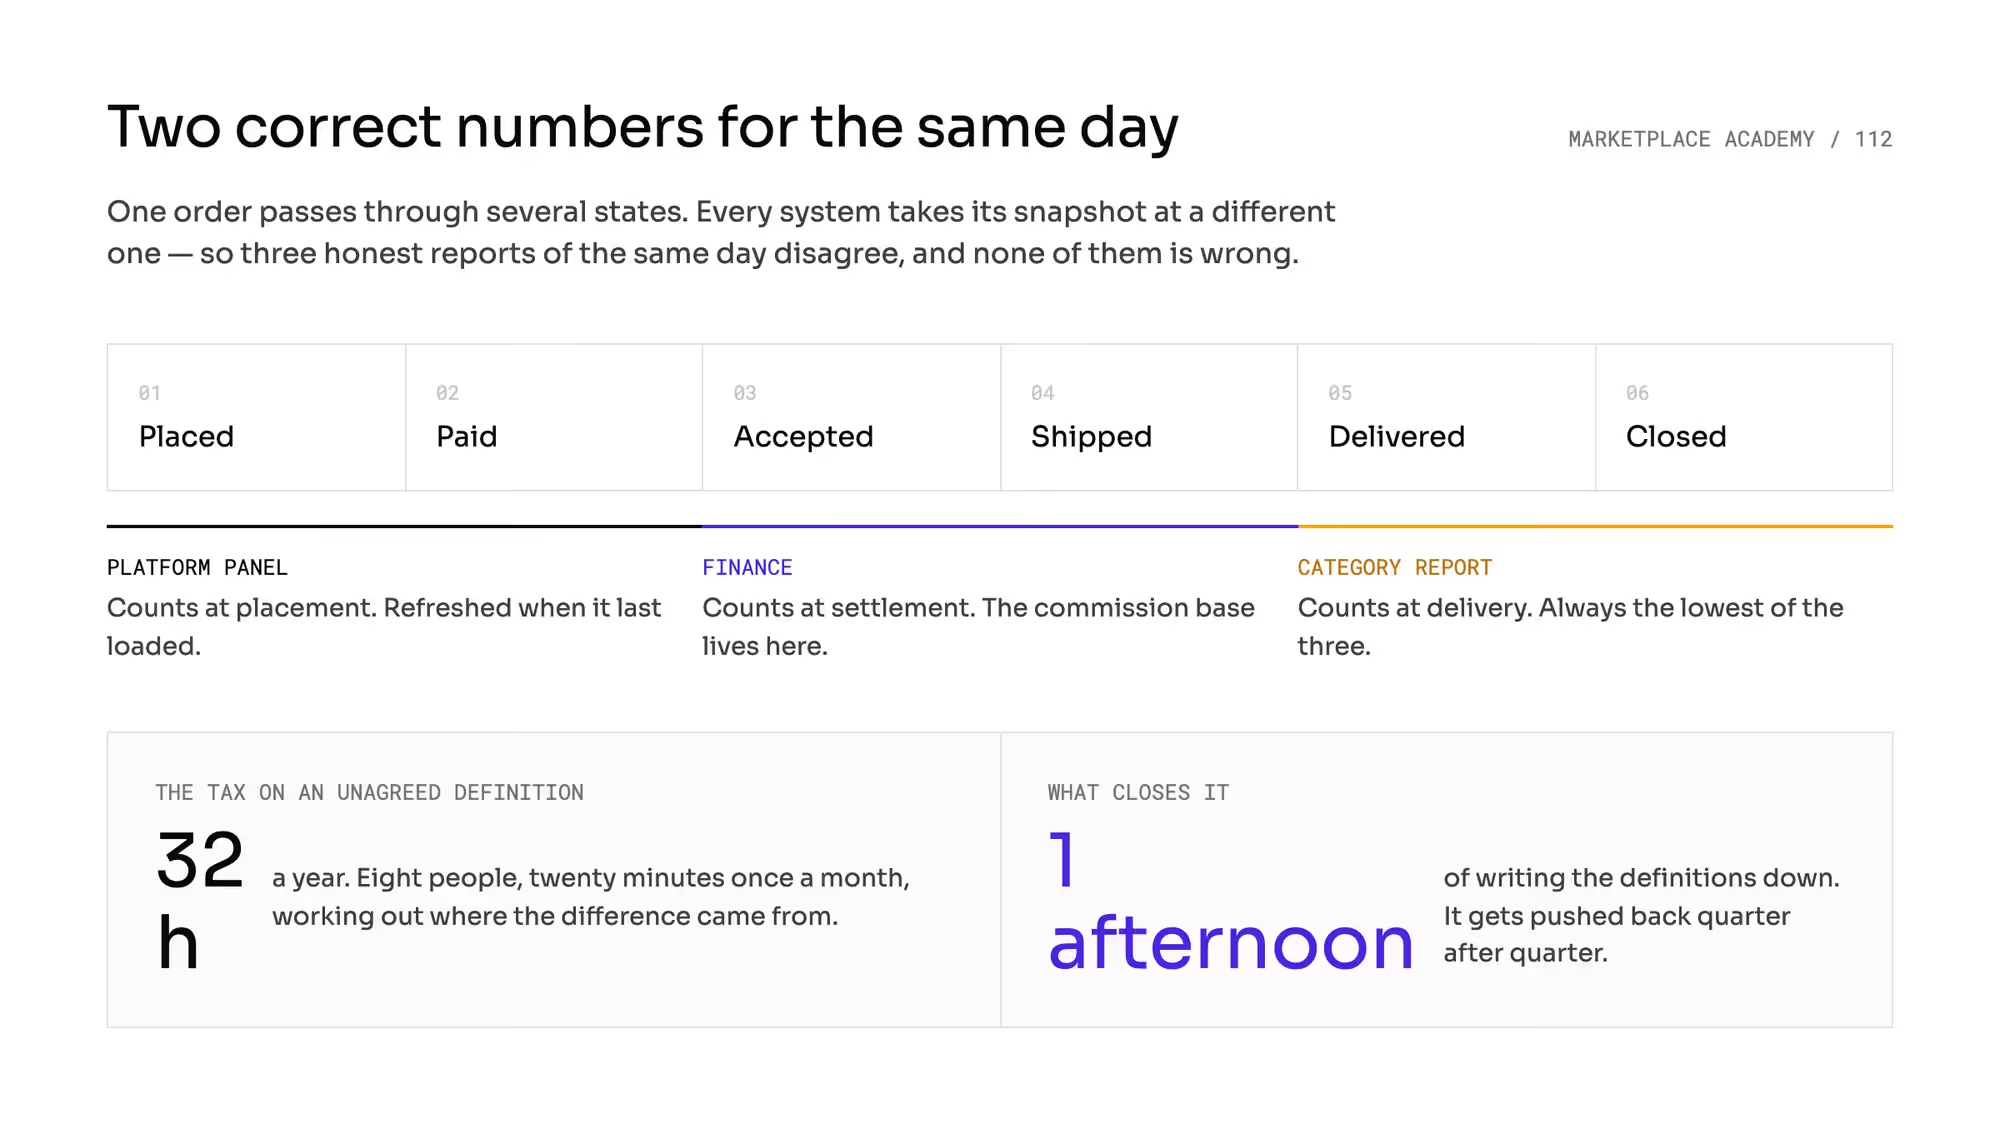
The gap between the admin panel and your own report is almost never an arithmetic error. Both sides count correctly, but they count different things at different moments.
The admin panel shows the platform database as it was at its last refresh. It uses its own end of the day and its own default date range.
Your BI tool shows its own copy of the data. That copy is always fed with a delay.
1. Reproducing the platform's count costs the most
Exporting the data is the cheap part. Reproducing the way the platform counts costs far more.
An analyst can spend weeks getting a report to show the number the admin panel shows on screen. That work starts again every time a definition changes on either side.
2. Argument about the true number is about definitions
Your team argues about the two correct numbers every month. The argument is about definitions, and it costs you time.
Say an eight-person committee spends 20 minutes once a month working out where the difference came from. That's 160 person-minutes a month and 32 hours a year.
It adds up to four working days of one person. Those hours come from the best-paid people in the company.
Writing the definitions down takes one afternoon. It gets pushed back quarter after quarter because it's never the most urgent item on the list.
What makes the same marketplace sales show different turnover in two reports?
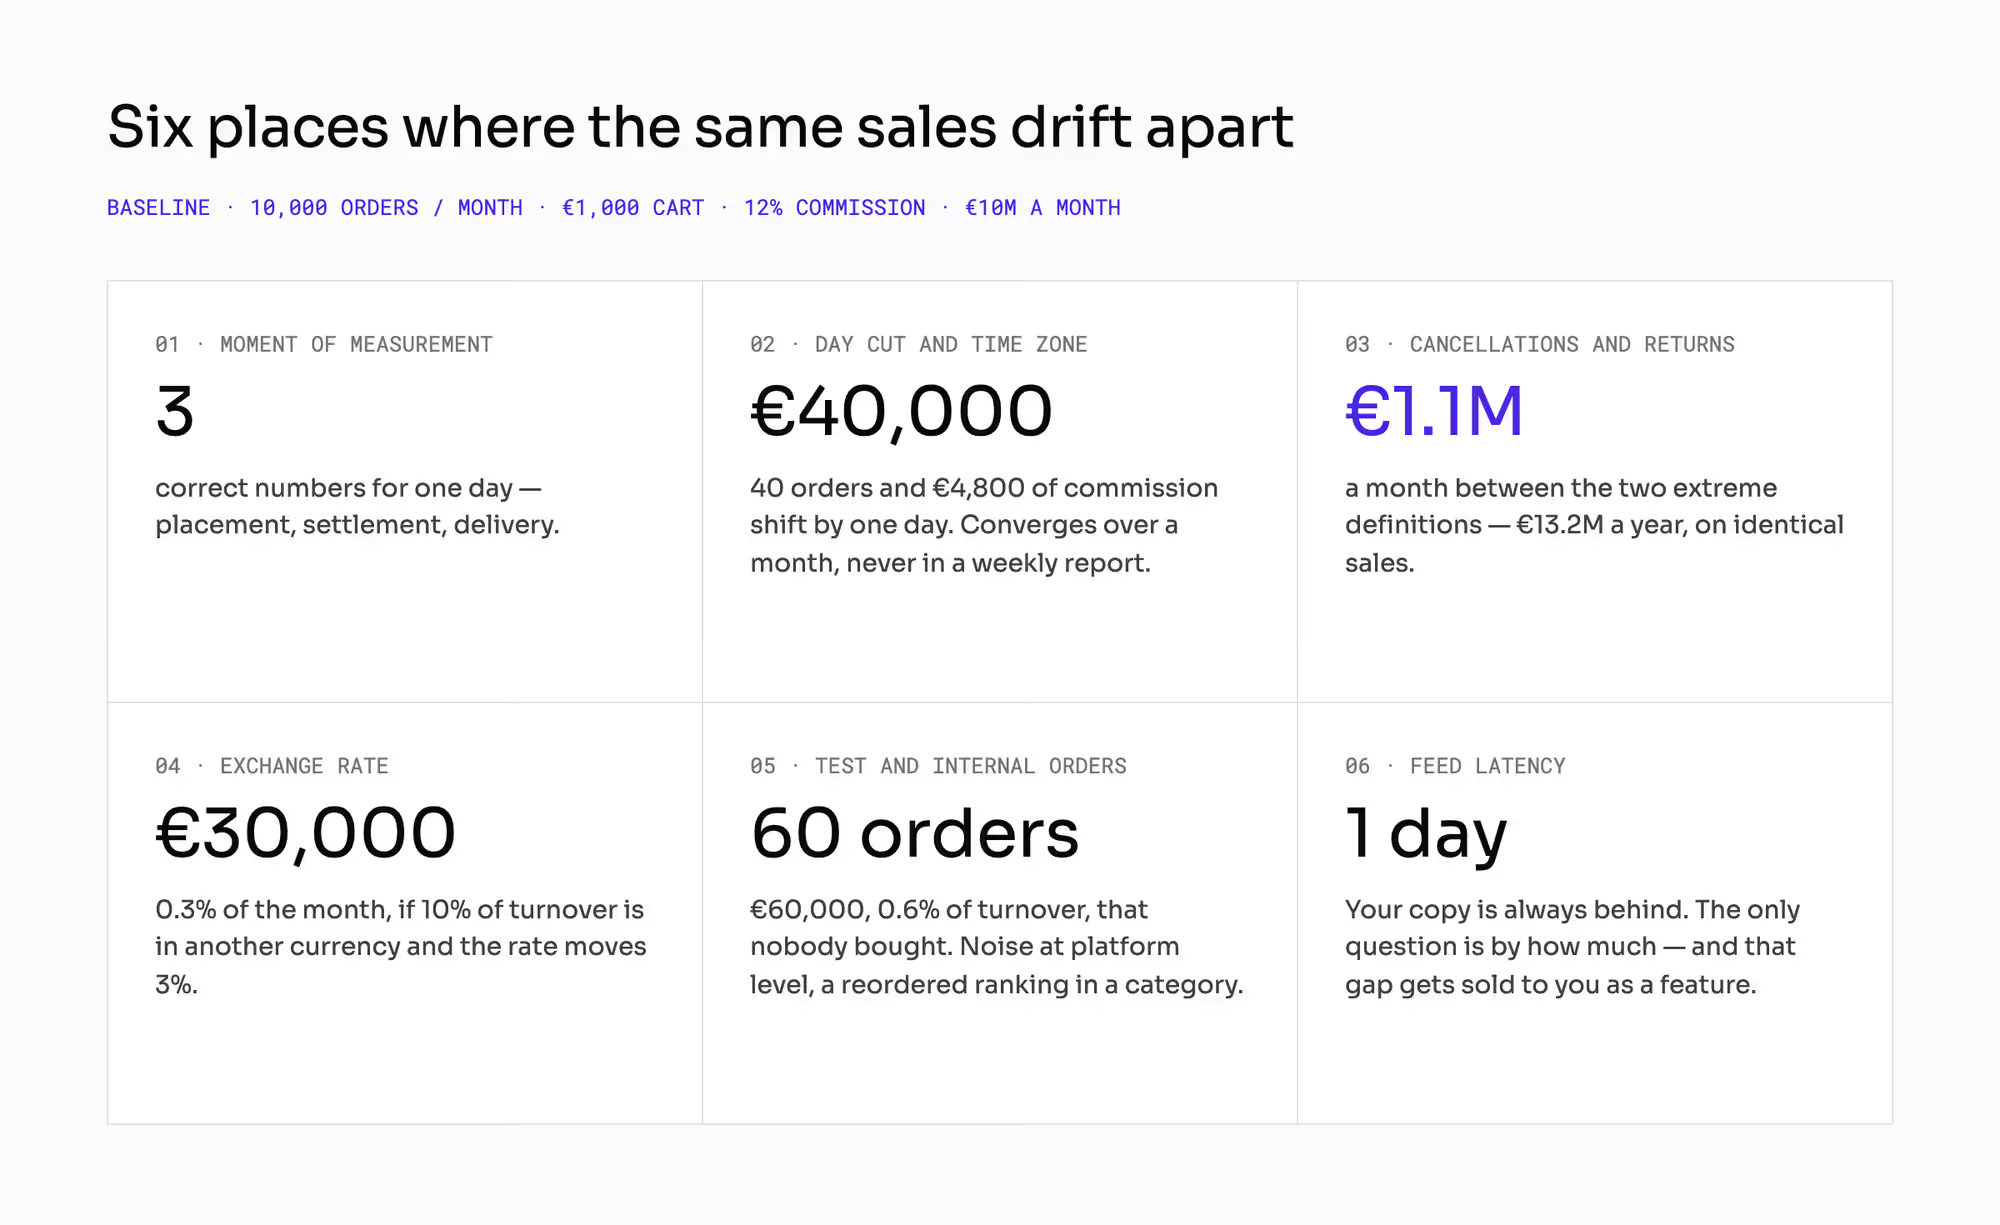
Every number below comes from one hypothetical marketplace: 10,000 orders a month, 300 sellers, 200,000 offers, a €1,000 average cart and a 12% commission. That gives you €10 million of turnover a month and €120 million a year.
A day on this marketplace brings about 333 orders and €333,000 of turnover. Six choices make two reports of those same sales disagree.
1. Moment of measurement
An order passes through several states: placed, paid, accepted by the seller, dispatched, delivered, and closed. Each system takes its snapshot at a different state.
The admin panel may count at placement, finance at settlement, and the category report at delivery. You get three correct numbers for the same day.
You decide separately which system owns which object. The chapter on single source of truth covers who owns which data.
2. End of the day and time zone
Two systems can end the day at different times. Late-evening sales then land on Tuesday in one report and on Wednesday in the other.
Say the last two hours before midnight bring 12% of daily sales. That's 40 orders, €40,000 of turnover and €4,800 of commission shifting by one day.
The difference evens out over a month. It stays in a daily or weekly report.
Analytics tools also have their own reporting time zone, which sets the day boundary regardless of the source of the data. Changing that time zone doesn't work backwards. The series keeps a dip or a bump at the point of the change.
3. Cancellations and returns
Take 3% cancellations and 8% returns on 10,000 orders. The same month now gives you three numbers to defend: €10 million, €9.7 million and €8.9 million.
The gap between the two extreme definitions is €1.1 million a month and €13.2 million a year. The sales behind both numbers are identical.
4. Exchange rate
Say 10% of your turnover is booked in another currency. That's €1 million a month. If the rate changes by 3% between the order date and the settlement date, the same month comes out €30,000 higher or lower.
That's 0.3% of the whole month. Choose the rate date yourself, or you get whatever date another system uses.
The chapter on marketplace ledger covers the two dates every entry carries.
5. Test and internal orders
Say you onboard 20 new sellers a month and each places three test orders. That's 60 orders a month that no buyer placed. They add €60,000, or 0.6% of turnover.
That's noise for the marketplace as a whole. It can change a ranking inside one category.
Your 10,000 orders are spread across 200,000 offers. A single offer sells once every 20 months on average. Three test orders can make an offer look like a bestseller.
The chapter on configuration management covers where sellers should test before they go live.
6. Feed delay
Your copy of the data is always behind the platform. Ask the vendor how far behind it is.
Vendors often present that delay as a feature. A once-a-day feed puts you a full day of sales behind.
How does marketplace reporting differ from live data?
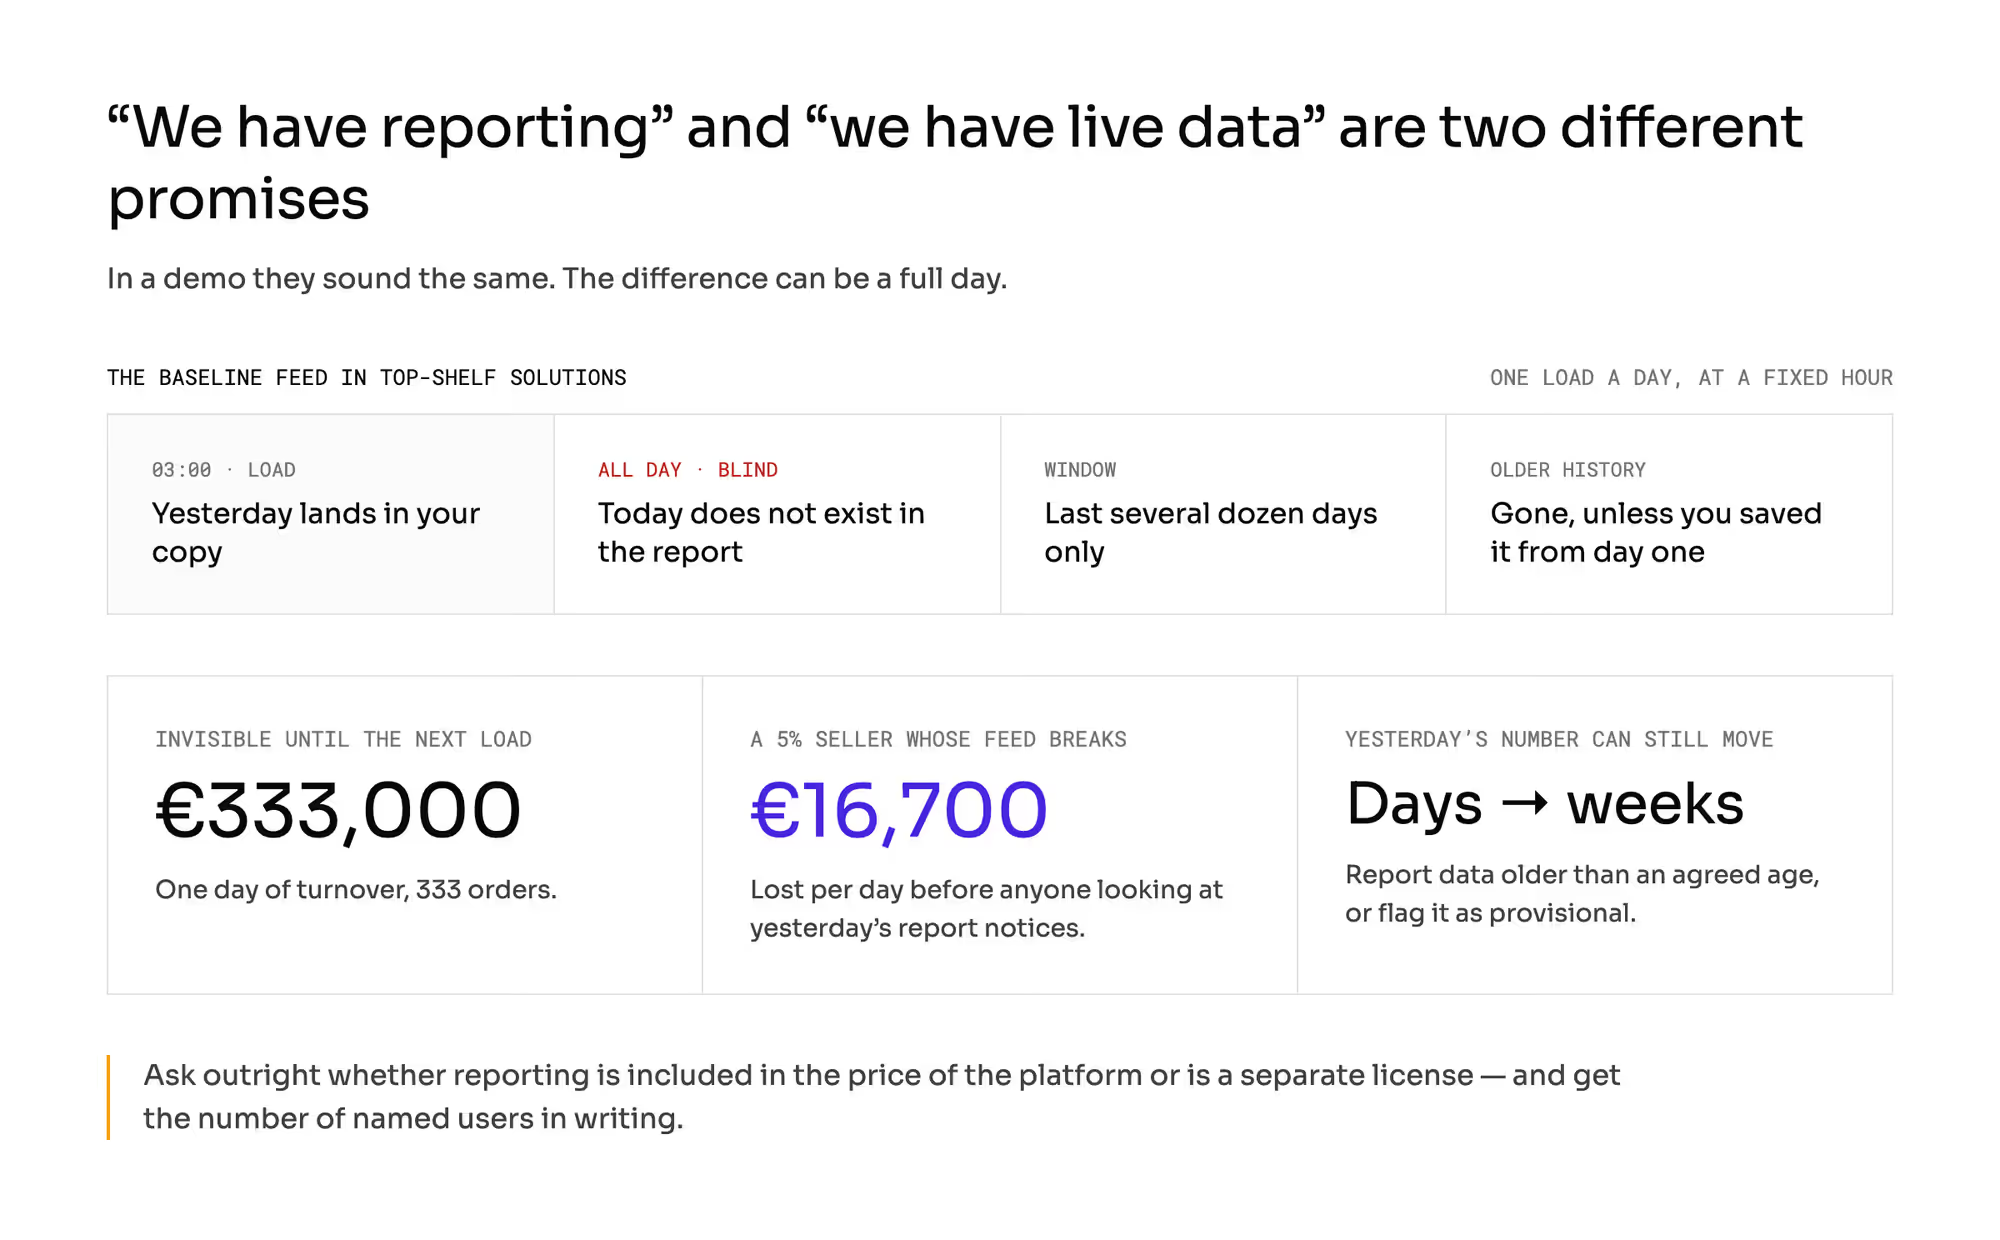
"Reporting" and "live data" sound like the same promise in a demo. The difference between them can be a full day.
1. Standard reporting feeds refresh once a day
Standard reporting feeds are slow. The standard reporting feed on enterprise platforms often refreshes once a day at a fixed hour. It covers a window of the last several dozen days.
A daily feed can't replace transactional data. Ask whether "open data" in the offer means this daily feed.
A daily feed leaves €333,000 of turnover out of your report until the next load. History older than the window is gone too, unless your team has saved it from the first day.
2. Daily feed hides a stopped seller for a day
The operational cost is higher. A seller who brings 5% of turnover sells €500,000 a month, or about €16,700 a day.
If their offer feed stops while you're reading yesterday's report, you lose a full day of their sales before anyone notices. The chapter on webhook integration covers how fast your systems exchange events.
3. Yesterday's number can still change
Traffic analytics tools such as Google Analytics 4 separate real-time, intraday, and daily data. Results can still be corrected for several days after the event, and sometimes for a couple of weeks.
If the board gets a number on Monday that is still changing, you need a rule. Either you report only data older than an agreed number of days, or you mark the newer data as provisional.
4. Reporting may be a separate license
Ask directly whether reporting is included in the platform's price. The question won't come up unless you raise it.
A full analytics layer is sometimes a separately licensed module. Sometimes access to raw data is included, but you pay for your own BI license and your own computing bill.
Both answers cost money. Get them in writing before you sign, together with the number of named users.
Which 4 marketplace metric definitions should you write down once?
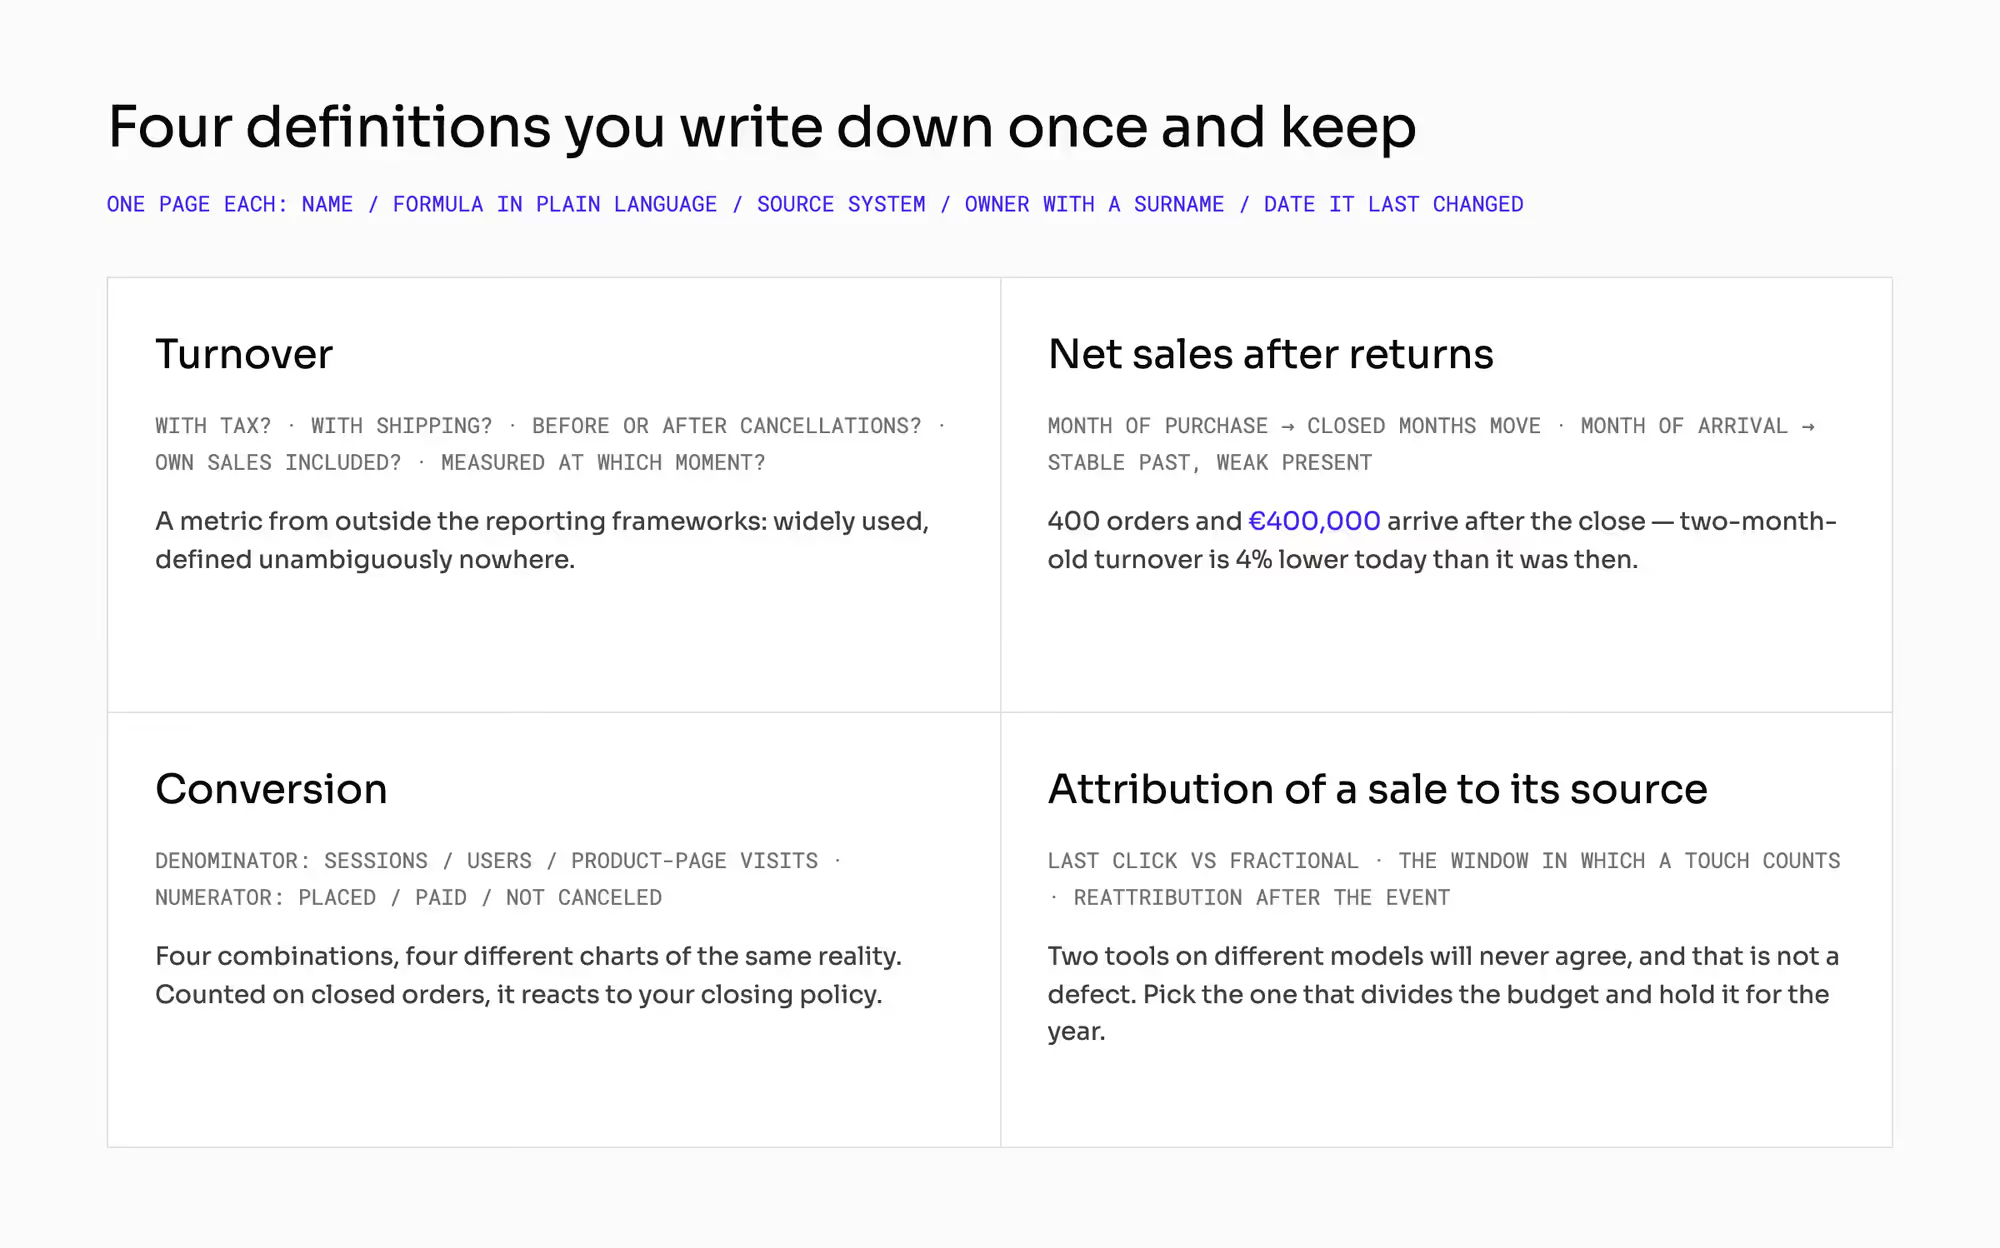
Each definition gets one page. The page holds the name, the formula in plain language, the source system, a named owner, and the date it last changed.
1. Turnover
Turnover needs five answers:
- With or without tax.
- With or without shipping.
- Before or after cancellations.
- With your own sales, or with third-party sellers only.
- At which moment you measure it.
No accounting framework defines turnover. Every team still uses it, and it usually leaves out both costs and returns.
2. Net sales after returns
Decide whether a return goes back to the month of the purchase or counts in the month it arrived. The first answer means closed months keep changing.
At 8% returns, you get 800 returns a month, and about half of them arrive after the month closes.
That's 400 orders and €400,000 that come in late. Turnover from two months ago is 4% lower today than it was at the time. The second answer gives you stable months and a current month that looks weaker than it is.
3. Conversion
Conversion needs a denominator and a numerator. The denominator can be sessions, users, or product page views. The numerator can be orders placed, orders paid, or orders not canceled.
Each combination gives you a different chart of the same sales. A rate calculated on closed orders also reacts to your closing policy, as well as to the quality of your service.
The chapter on marketplace order closing covers when an order counts as closed.
4. Attribution of a sale to its source
Attribution models give credit for a sale in different ways. One gives all the credit to the last click before the purchase. Another splits it across earlier touches.
Each model also sets a window in which a touch still counts. Some purchases get reattributed after the fact. Two tools with different models will never show the same number. That's expected.
Choose the model that divides your marketing budget and keep it for the whole year. A change halfway through breaks every comparison with earlier quarters.
The chapter on marketplace metrics covers which metrics to choose in the first place.
How do ordered turnover, turnover after cancellations, and net sales compare?
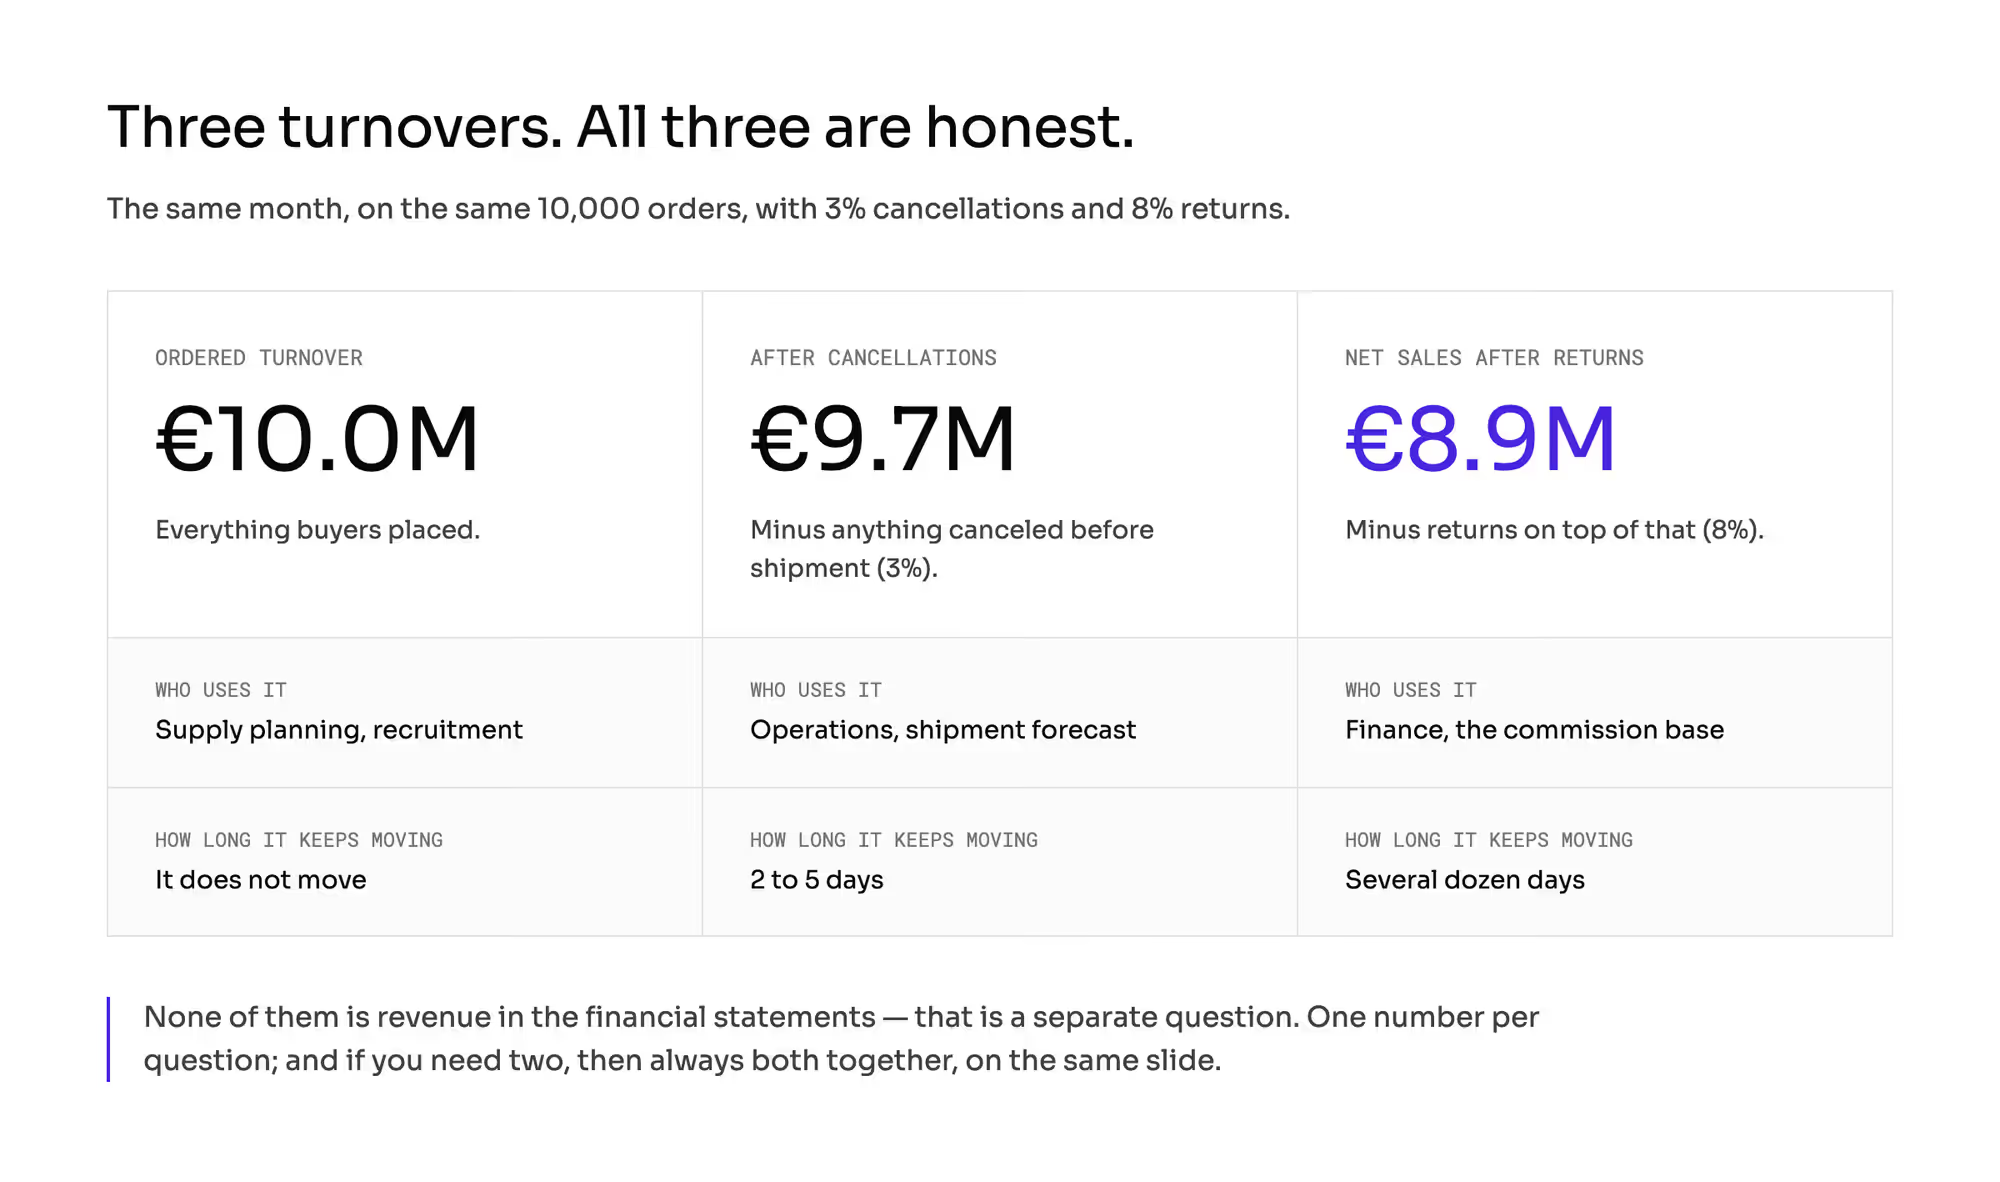
The table shows the three turnover figures for one hypothetical month of 10,000 orders. All three are correct, and each one serves a different team.
Which turnover figure? | What does it include? | How much for the month (€ million)? | Who uses it? | How long does it keep changing? |
|---|---|---|---|---|
Ordered turnover | everything buyers placed | 10.0 | supply planning, seller recruitment | it doesn't change |
Turnover after cancellations | minus orders canceled before dispatch (3%) | 9.7 | operations, dispatch forecast | 2 to 5 days |
Net sales after returns | minus returns on top of that (8%) | 8.9 | finance, the commission base | several dozen days |
None of the three is the revenue in your financial statements. The chapter on marketplace revenue recognition covers whether you book the commission or the full GMV.
Why is seller analytics a separate product on a marketplace?
Sellers watch their own numbers closely. Their revenue depends on them.
1. Every number you show a seller enters the next negotiation
Position in the category, share of impressions, and "your price against the market" all say something about other sellers. You decide how much of that data each seller sees.
The chapter on seller data isolation covers what one seller may see about another. The chapter on marketplace GDPR covers the limits on processing buyer data.
2. Hidden numbers come back as tickets
If you don't show sellers their results, they ask your support team. If each of your 300 sellers asks one question a month, you get 300 tickets.
Each ticket takes 15 minutes. That's 75 hours a month, and six productive hours a day make it about 0.6 of a full-time position.
3. Seller panel has to match the settlement
The number in a seller's panel has to match the number in their settlement. If the screen uses one base and the settlement uses another, you get a ticket every time.
The chapter on commission rate drift covers rates that stop matching the seller's contract. The chapter on marketplace seller quality metrics covers the separate set of metrics you judge sellers on.
Some operators end up building sellers a results portal outside the platform. Put that cost in the business case from the start.
Who decides which marketplace metric goes to the board?
Treat a change to a metric's definition as a formal decision. It has a named owner, a date, and an entry in a register.
You also have to decide what happens to the history. Either you recalculate history, or you leave the series with a visible step. Both answers are fine, as long as you choose one and write it down.
1. Default date range is a definition too
Weekly and monthly meetings often use screenshots from the admin panel. Each screenshot carries a default filter that no one reset because no one noticed it.
The board then sees a number that no one chose.
2. One number per question
Use one number per question. If you need two, always show both together. Ordered turnover and net sales after returns can sit on the same slide.
They can't sit on two slides in two departments under the same name.
The chapter on marketplace payment reconciliation covers how duties around money are split. The question here is narrower: who may change the meaning of a number the board decides on.
What does marketplace analytics change in your marketplace?
Settle marketplace analytics in your contract and your budget before launch. A problem with any of them shows up later as a number no one trusts.
1. Metric consistency is separate from reconciliation
Reconciliation checks whether the money your system shows is really there. Metric consistency checks whether two correct numbers mean the same thing.
You can reconcile every transfer and still not know how much you sold.
2. Feed frequency belongs in the contract
If the contract says "reporting" without a frequency, an hour, and a window depth, you can't hold the vendor to anything. Write all three into the contract.
3. Analytics layer is a line in the budget
The budget line covers the tool, the licenses, an analyst's position, and the time it takes to reproduce the platform's count. Budget for your own management reporting, even if the vendor's admin panel looks complete.
4. Report access and retention need a record
The chapter on audit log covers who saw which report and how long you keep the record. The chapter on marketplace order documents covers documents and how long you keep them.
How do you check marketplace analytics with a vendor?
Spend one afternoon on five steps before you meet the vendor. The result is one document.
- List the metrics that come up at board meetings. There are usually 8 to 12.
- Next to each one, write the formula in plain language, the source system, and a named owner.
- For each one, settle the five choices: the moment of measurement, the end of the day, cancellations and returns, the exchange rate, and test orders.
- Take one closed month and calculate every metric two ways. Start work on any difference you can't explain in five minutes.
- Send the document to everyone who reports numbers outside the company.
Then ask the vendor these five questions, and ask to see each answer on screen:
- How often and at what hour does the data on this screen refresh, and in which time zone do you count the day?
- How far back does the data available to us reach, and what happens to history older than that?
- What is the definition of turnover in this report: with or without tax, shipping, cancellations, and returns?
- Can yesterday's number still change, and for how many days?
- What does the price include: ready-made reports, raw data access, how many users? Which parts need a separate license, and from whom?
If no one can answer the third question without a phone call, the vendor hasn't written the definition down.
Which mistakes do operators make with marketplace analytics?
Each of these mistakes looks like a data problem. You fix each one by making a decision.
1. Treating the difference as a bug
You send someone to "make these reports agree" without settling the definitions. The task comes back every month.
2. Admin panel screenshot as a management number
The screenshot arrives with a default date filter that no one set on purpose. The board decides on a number no one chose.
3. Buying reporting with no feed frequency in the contract
You find out after launch that the freshest number comes from the middle of the night. You then build a second layer with your own money.
4. Changing a definition mid-year without a record
The chart shows growth that never happened. No one knows how to undo it.
5. Showing a seller a different number from their settlement
Each difference becomes a ticket. Those tickets can take most of a full-time position when you have 300 sellers.
What do you still have to settle about marketplace analytics?
This chapter doesn't cover money reconciliation between the platform, the payment provider, the bank, and accounting. The chapter on marketplace payment reconciliation covers that work.
This chapter also leaves three money questions to their own chapters:
- The chapter on marketplace revenue recognition covers what counts as your revenue in the financial statements.
- The chapter on marketplace ledger covers how to build the ledger and seller balances.
- The chapter on commission rate drift covers how to keep commission rates right.
This chapter doesn't settle what you may show one seller about other sellers. It also doesn't settle how long you keep reports with buyer data.
Confirm both with your lawyer, because the answer depends on your model and your contracts. Three chapters cover the mechanisms:
- The chapter on seller data isolation covers the isolation mechanism.
- The chapter on marketplace GDPR covers personal data.
- The chapter on P2B regulation covers the information you owe sellers.
This chapter doesn't name an analytics tool. The right choice depends on the tools you have today.
All the numbers above are hypothetical. Put in your own share of cancellations, your own share of returns, and your own feed delay. You need to know who calculated each number on a slide.
Summary: Why doesn't your BI report match the marketplace admin panel?
Your BI report and the admin panel disagree because they count different things at different moments. Six choices decide the gap: the moment of measurement, the end of the day, cancellations and returns, the exchange rate, test orders, and feed delay.
Marketplace analytics becomes consistent when you write down four definitions and give each one an owner. Then put the feed frequency in the contract and the analytics layer in the budget. Show sellers numbers that match their settlements.
Building a marketplace in which every report counts sales the same way?
Frequently asked questions on marketplace analytics
What is marketplace analytics?
Marketplace analytics is the set of reports and metrics an operator uses to measure sales, sellers, and buyers on a marketplace. It covers turnover, returns, conversion, and attribution. It also covers the numbers each seller sees in their own panel.
How is marketplace analytics different from eCommerce analytics?
Marketplace analytics adds sellers, commission, and settlements to what eCommerce analytics measures. eCommerce analytics for one store tracks traffic, conversion, and sales. A marketplace also has to report per seller and keep each seller's numbers matched to their settlement.
Why does my BI report show different numbers than the admin panel?
Your BI report shows different numbers than the admin panel because the two count different things at different moments. The usual causes are the moment of measurement, the day boundary, cancellations and returns, the exchange rate, test orders and feed delay. Write one definition per metric and choose which system the board reads.
Ready to build?
We build marketplaces that count turnover the same way in the admin panel, the seller panel and every settlement.